Data Literacy Training for the Logistics & Supply Chain Sector
Logistics is a sector where data literacy directly compresses thin margins: on-time delivery, cost per shipment, fleet utilisation, and inventory accuracy. Operations span many DCs, hubs, and routes, so consistent metric definitions across regions determine whether benchmarking is honest or misleading. Diagnostic analytics for delays and predictive analytics for seasonal capacity are baseline capabilities for modern ops teams.
- 4.9/5 · 287 reviews
- 300+ clients nationwide
- 2,000+ trainers
- 1 to hundreds of participants
- Standard · Premium · Private 1-on-1
- format
- In-house / online / hybrid
- duration
- 3 days per cohort
- participants
- 10-30 per batch
- language
- Indonesian / English
2,000+ trainers and experts
Our group's teaching network, matched to what your team needs.
See class documentationYou see your trainer first
The trainer's profile, track record and field come with the proposal, before you decide.
4.9 out of 5
287 participant reviews.
300+ clients nationwide and 180,000+ private training sessions completed. Among them: MPR RI, Akademi Militer Magelang, DPRD Provinsi Jawa Timur.
One person to hundreds
Private coaching for one participant, a class for one team, or several cohorts at once.
Three budget levels
- Standard: core class, material fitted to the participants’ work
- Premium: senior trainer, deeper material design
- Private 1-on-1: one participant, one trainer, schedule set by the participant
Why Data Literacy & Business Analytics is different in Logistics & Supply Chain
Logistics is a sector where data literacy directly compresses thin margins: on-time delivery, cost per shipment, fleet utilisation, and inventory accuracy. Operations span many DCs, hubs, and routes, so consistent metric definitions across regions determine whether benchmarking is honest or misleading. Diagnostic analytics for delays and predictive analytics for seasonal capacity are baseline capabilities for modern ops teams.
- OTD / cost-per-shipment definition consistency across DCsPasses metric harmonisation under a single glossary
- Peak-season capacity forecast accuracyImproves against historical baseline
- Reduction of recurring delays on priority routesTracked on the route Pareto dashboard
- Law No. 22/2009 Traffic & Road Transport — fleet journey data
- Transport Ministry regulations on goods-delivery safety
- ISO 28000 Supply Chain Security — international reference
- UU PDP No. 27/2022 — recipient/sender data as personal data
- Head of Operations / Logistics COO
- Hub / DC Manager
- Fleet & Last-Mile Manager
- S&OP / Demand Planning Lead
- Inventory & Warehouse Analyst
- Customer Experience / Service-Level Lead
- Operations managers read on-time delivery, cost per shipment, and fleet utilisation with consistent definitions
- Hub & DC managers run diagnostic analytics for recurring delays (route, courier, parcel category)
- Planning teams use simple predictive analytics for peak-season capacity
- Inventory accuracy & stock-outs are analysed via ABC + cohort movement
- Cross-functional SLA definitions (sales–operations–CX) are agreed via a shared metric glossary
Quick Answer
Data literacy & business analytics training is an in-house program that teaches non-technical teams to read, work with, analyze, and argue with data so decisions become evidence-based and replace assumption-based reasoning. The curriculum is mapped to the DIKW pyramid, the Gartner Analytic Ascendancy (descriptive→prescriptive), and the four Data Literacy Project competencies, measured with Kirkpatrick, aligned with the PDP Law.
Mapped to recognized data literacy frameworks
The curriculum follows the DIKW pyramid (Data→Information→Knowledge→Wisdom), the Gartner Analytic Ascendancy Model (descriptive→diagnostic→predictive→prescriptive), and the four Data Literacy Project/Qlik competencies (Read, Work, Analyze, Argue), each an established industry framework. Data storytelling uses Cole Nussbaumer Knaflic's principles & Stephen Few's visual design.
Data literacy without PDP awareness actually increases risk
Since PDP Law No. 27/2022 came into full force (October 2024) with administrative sanctions, analytics that spreads raw personal data across shared dashboards is a real compliance risk. This program's governance module teaches aggregation/anonymization and data limits from day one; for agencies/SOEs the One Data Indonesia principles (Presidential Reg. 39/2019) are referenced.
The most common mistake: training the tool while skipping the thinking & culture
Many programs stop at 'how to use Power BI'. Industry research (Gartner, Forrester/Tableau) shows low data literacy & the absence of a data culture are the top roadblocks to data value, ranking ahead of tooling gaps. This program unites thinking (the DIKW/Gartner ladder), skills, governance, and decision culture (the DELTA model, anti-HiPPO).
Clients & Documentation
Some of the institutions we have trained
Photos from sessions we have delivered, each one named after the institution it belongs to.
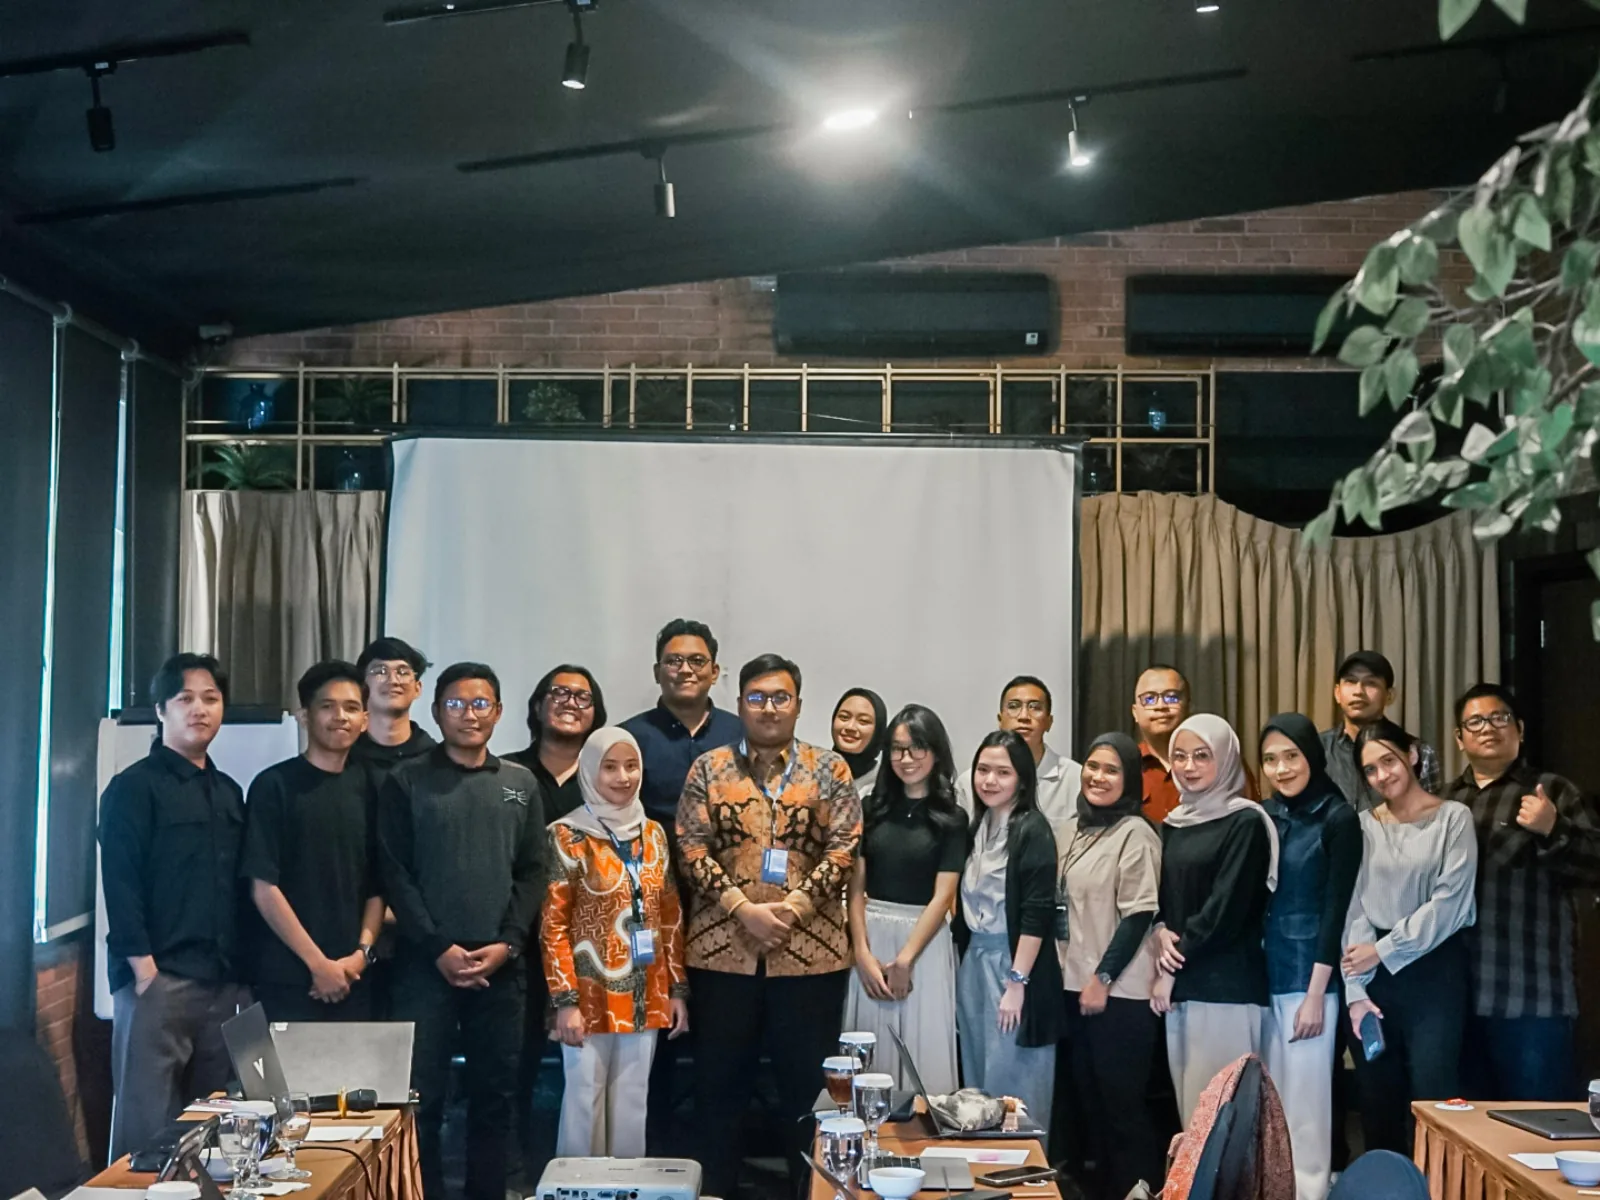
MPR RI

Akademi Militer Magelang
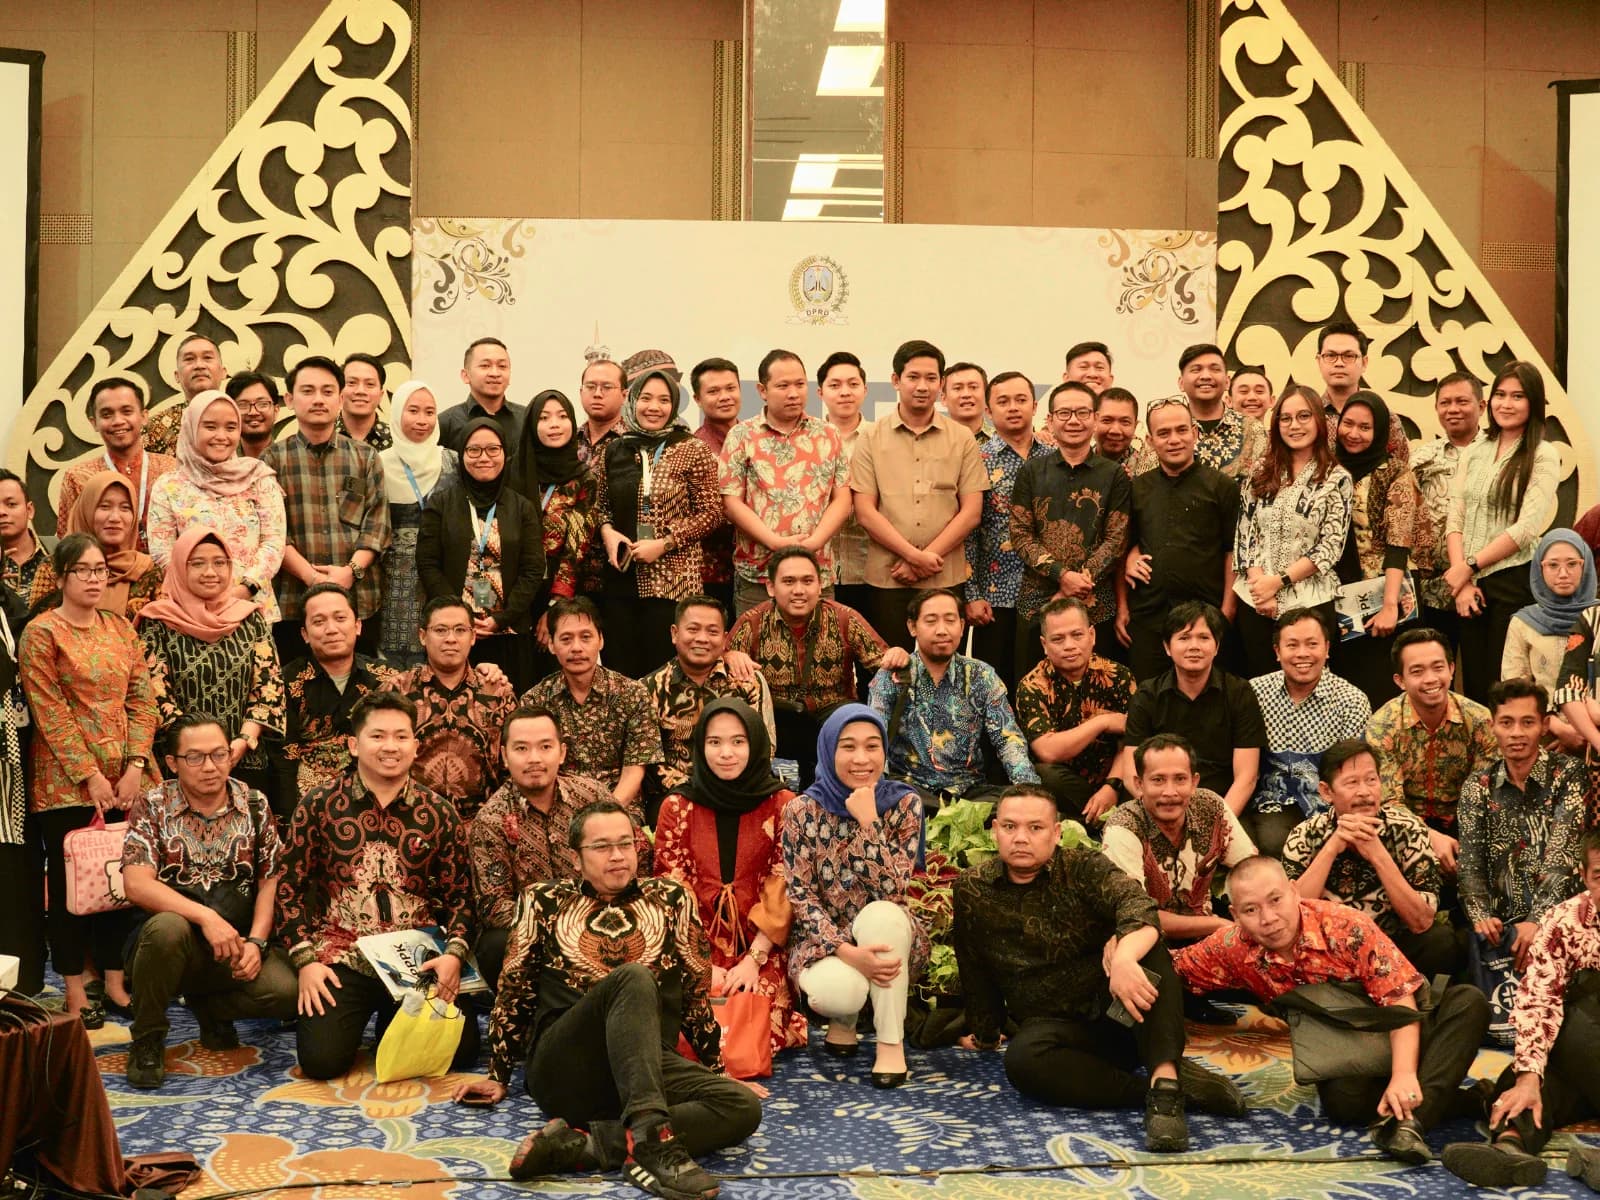
DPRD Provinsi Jawa Timur

DPMPTSP Pemprov Maluku Utara
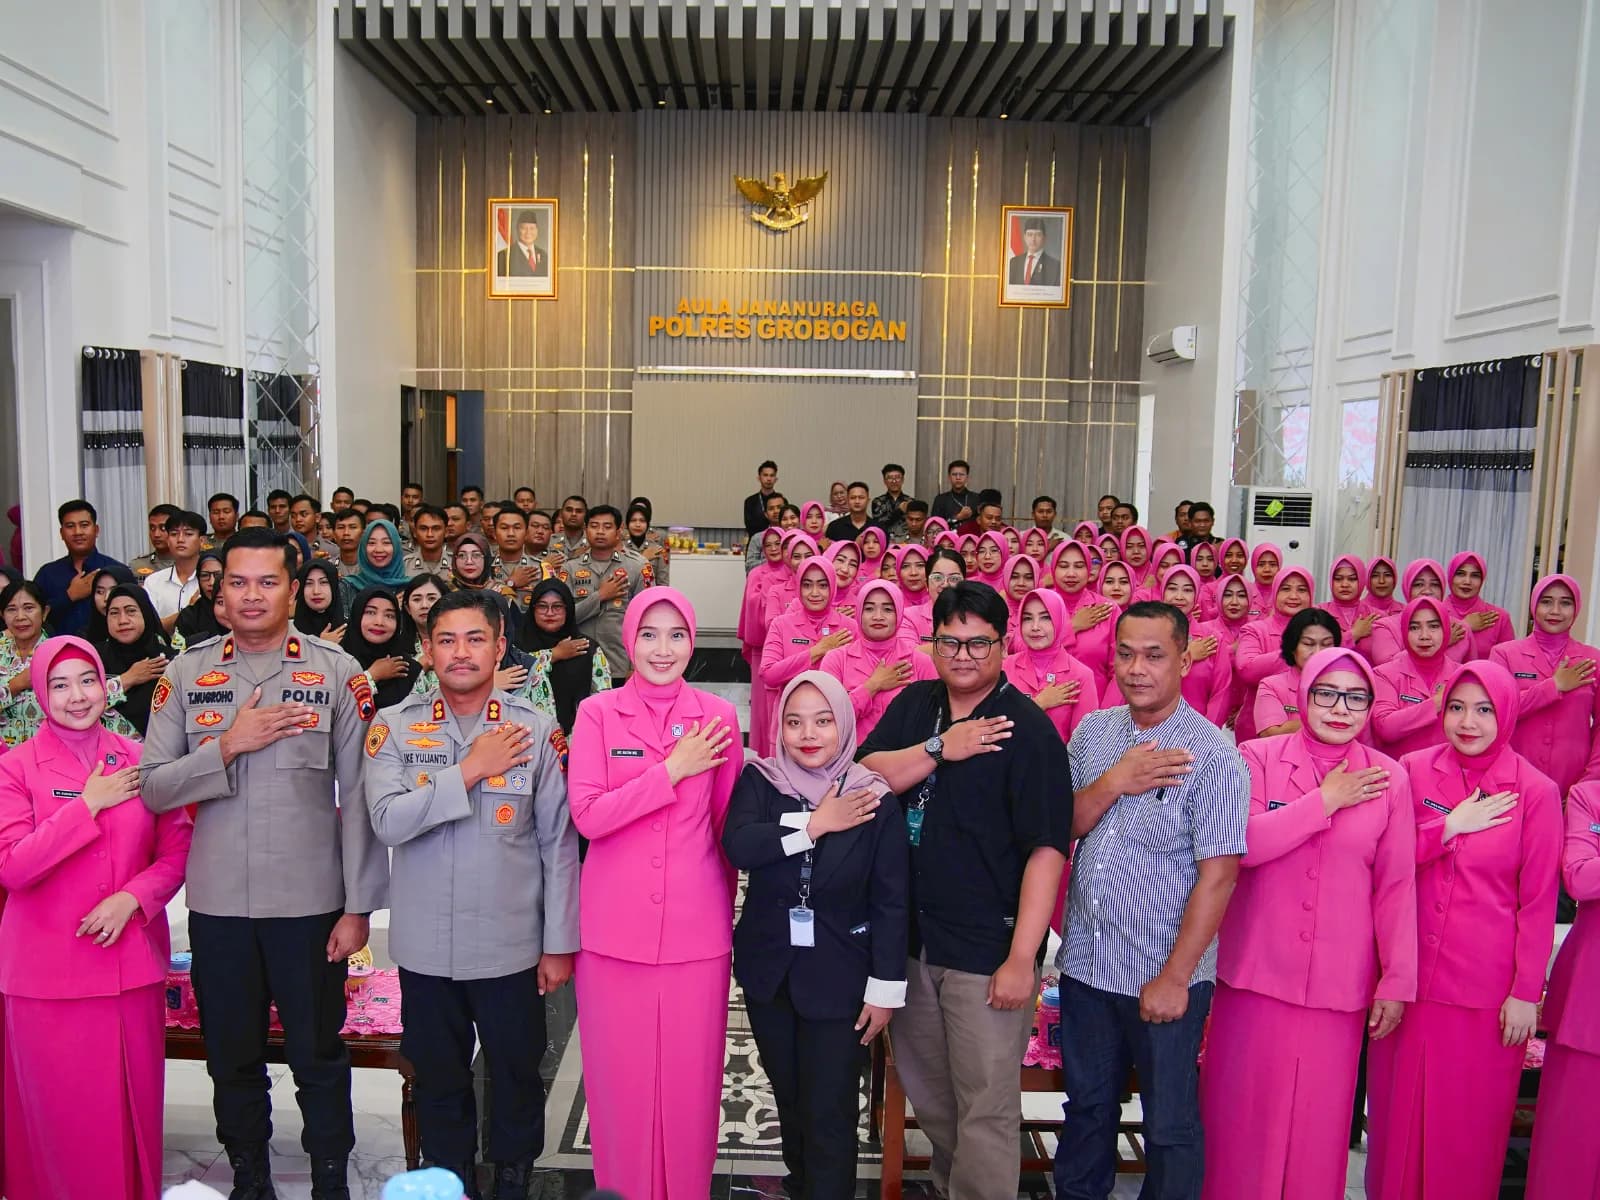
Polres Grobogan

BKPSDM Cirebon
Data Literacy & Business Analytics
Data literacy training is an in-house program that equips employees (especially non-technical staff) with the ability to read, work with, analyze, and argue with data so that business decisions rest on evidence, displacing assumptions or the most senior person's opinion. The curriculum is mapped to the DIKW pyramid (Data→Information→Knowledge→Wisdom), the Gartner Analytic Ascendancy Model (descriptive→diagnostic→predictive→prescriptive), and the four Data Literacy Project/Qlik competencies (Read, Work, Analyze, Argue), measured with the Kirkpatrick model, and aligned with Indonesia's Personal Data Protection Law No. 27/2022 and the One Data Indonesia principles for SOE/government contexts.
Measurable Outcomes
Expected Outcomes
Success indicators mapped to Kirkpatrick/Phillips evaluation levels: qualitative targets, set jointly during the TNA against the organization's baseline. External benchmarks are cited as industry reference, with no guarantee of identical results.
- Decisions rest on evidence
- Most routine team decisions backed by data & critical questions that override the most senior opinion (anti-HiPPO). Visible in how meetings use numbers to open an argument (Kirkpatrick L3).
- Teams can run their own analysis
- Participants can produce basic descriptive & diagnostic analysis without queuing for the central data team. Seen when participants answer their own questions without queueing (Kirkpatrick L3).
- Numbers get read correctly
- Participants pass an assessment on reading dashboards, correlation vs causation, and visualization traps. Judged through exercises reading deliberately misleading charts (Kirkpatrick L2).
- Dashboards used without waiting on the data team
- Increase in weekly use of the BI tool/analytical spreadsheet from the team baseline. Read from how many active users the reporting tool carries (Kirkpatrick L3).
- One metric definition across divisions
- A shared KPI glossary agreed across units so 'one metric, one definition'. Read from the metric dictionary divisions agree on (Kirkpatrick L4).
- Monetary value of decisions that hit the mark (optional)
- An estimate of improved decision value with training-effect isolation, if finance requests a figure. The rupiah view comes via Phillips L5 when management needs it.
Program Format
Program Format Options
Chosen by data maturity, role spread, and operational schedule, finalized after the TNA. One cohort is usually reading and presenting data on its own after those three days. Organizations wanting data literacy spread evenly to every division attach a tiered three to six month programme, at different depth for each role.
Data Literacy Level Assessment (0.5-1 day)
An initial data literacy diagnostic (reading data, metric interpretation, bias awareness) to form tiered batches and map the organization's position on the analytics maturity stages (Davenport DELTA model reference).
Data Literacy & Analytics Bootcamp (2-3 days)
From data mindset & ethics, reading dashboards correctly, descriptive & diagnostic analytics, to data storytelling for decision-makers: the full Gartner analytics ladder introduced at a depth matched to the role.
Tiered Program (3-6 months)
Phased modules following the 70-20-10 pattern: formal classes, analysis assignments from the team's own data, office hours, and monthly application reviews progressing toward basic predictive analytics.
Role-Based Blended Program (custom)
A combination of assessment, an executive track (data storytelling & challenging data), an analyst track (spreadsheet→SQL→BI tool), and a data-owner track (governance, metric definitions, PDP/One Data) in one coordinated initiative.
Free Consultation
Discuss your team's data literacy needs
We map your roles, data maturity, and decision needs, then build a proposal & budget estimate based on real needs.
Curriculum
Curriculum Framework
Designed with ADDIE and mapped to DIKW + the Gartner Analytic Ascendancy + the four Data Literacy Project competencies; the final modules are curated to the TNA results and roles. The topics below are the full scope that can be activated.
- The DIKW framework: from raw data → information → knowledge → wise decisions
- Correlation vs causation, confounding, and the 'numbers speak for themselves' trap
- Data biases: sampling bias, survivorship bias, Simpson's paradox with business examples
- Anti-HiPPO: countering the 'Highest Paid Person's Opinion' (Kaushik) with evidence & critical questions
- Four core questions before trusting a number: source, definition, context, uncertainty
- The four Data Literacy Project/Qlik competencies: Read, Work, Analyze, Argue
- Choosing relevant metrics & designing SMART KPIs (vanity metric vs actionable metric)
- Reading trends, seasonality, outliers, and anomalies without over-interpretation
- Visualization traps (Stephen Few reference): truncated axes, 3D, pie-chart abuse, misleading dual-axis
- Reading ranges & uncertainty: mean vs median, distribution, and the 'deceptive average'
- Gartner Analytic Ascendancy Model: positioning descriptive & diagnostic on the analytics ladder
- Spreadsheets for analysis: pivots, lookups, aggregation, and avoiding fatal Excel/Sheets errors
- Intro to SQL for non-technical staff: SELECT/FILTER/GROUP BY/JOIN to 'ask the data' independently
- Segmentation, funnel analysis, and simple cohorts to diagnose 'why did the number change'
- Data-driven root-cause analysis: structured drill-down replacing guesswork
- The top of the Gartner Ascendancy: predictive ('what will happen') & prescriptive ('what should we do')
- Basic forecasting & trends: when to trust them, when they mislead
- Reading model output & predictive dashboards without becoming a data scientist
- Simple what-if & scenarios for business decisions (intro to prescriptive)
- When advanced analytics is needed and when descriptive analytics already suffices (decision efficiency)
- Data-driven narrative structure: context → conflict (insight) → resolution (recommendation)
- Cole Nussbaumer Knaflic principles: choose the right visual, declutter, focus attention (preattentive attributes)
- Honest visualization (Stephen Few): data-ink, avoid distortion, one message per chart
- Presenting uncertainty & data limits honestly to the board/committee
- Turning findings into decisions & actions with documented follow-through
- Metric definitions & a shared KPI glossary: 'one metric, one definition' across units
- Data quality: accuracy, completeness, consistency, timeliness (data quality dimensions)
- PDP Law No. 27/2022: personal data in analytics, anonymization/aggregation, controller/processor roles
- One Data Indonesia principles (Presidential Reg. 39/2019): data standards, metadata, interoperability for agencies/SOEs
- Davenport DELTA model (Data, Enterprise, Leadership, Targets, Analysts) & data culture roadmap; a data champion network (70-20-10 pattern)
Comparison
Choosing a Program Format
A concise decision matrix. The final recommendation is set after the training needs analysis.
| Aspect | Level Assessment (0.5-1 day) | Literacy & Analytics Bootcamp (2-3 days) | Tiered Program (3-6 mo) | Role-Based Blended Program (custom) |
|---|---|---|---|---|
| Primary goal | Diagnose level & maturity position | Broad basic literacy & analytics | Measurable data culture transformation | Sharply different needs across roles |
| Ideal participants | Before a large-scale roll-out | Managers & analysts across functions | A large population in phases | Executives + analysts + data owners |
| Analytics ladder coverage | Initial position mapping | Descriptive & diagnostic | Up to an intro to predictive | Tailored per role track |
| Data governance depth | Metric-definition gap mapping | PDP principles & shared metrics | KPI glossary + data quality | Full data-owner track (PDP/One Data) |
| Evaluation level | Baseline diagnostic | Kirkpatrick L1-L2 | Kirkpatrick L1-L4 (+Phillips L5) | L1-L4 per track (+Phillips L5) |
For Whom
Who Is This Program For?
Built by role via the TNA, because decision needs, analytical depth, and data responsibility differ sharply across functions.
Leaders & functional managers (decision-makers)
Lead metric-based decisions and challenge the data presented before acting.
Common challenges
- Misreading dashboards or being fooled by misleading visualizations
- Decisions still dominated by intuition/the most senior opinion (the HiPPO effect)
- Struggling to tell correlation from causation when judging team reports
Analysts & operational staff (daily data handlers)
Process daily unit data and prepare analysis for decision-makers.
Common challenges
- Not yet independent in producing descriptive/diagnostic analysis without queuing for the central data team
- Stuck in spreadsheets, unable to 'ask the data' via SQL/BI tools
- Presenting numbers without a narrative so findings go unactioned
HR, L&D & People Development teams
Design measurable data literacy programs accountable to leadership.
Common challenges
- Hard to assess initial data literacy levels so batches are mismatched
- Generic content is either too technical or too shallow for the actual role
- No recognized evaluation framework (Kirkpatrick/Phillips) to prove impact
Data owners, BI, Risk & Compliance
Ensure independent analytics stays aligned with data quality, metric definitions, privacy, and regulation.
Common challenges
- Metric definitions differ across units ('which number is correct?')
- Self-service BI grows without governance, producing rogue dashboards
- PDP obligations & One Data principles not yet translated into daily analytics practice
Industry Context
Industry Applications
One specific use case per industry, citing real workflows, metrics, and regulatory context in that vertical.
Branch managers & risk teams read acquisition funnels, customer churn, and credit-risk dashboards correctly; diagnostic analytics for 'why did NPL rise', with customer data in analytics handled per PDP Law No. 27/2022 (aggregation/anonymization before sharing).
See in Banking & Financial Services context →Regional teams analyze sell-through, basket size, and campaign performance by region; data storytelling to recommend promo reallocation to leadership with a clear decision narrative.
See in Retail & FMCG context →Line supervisors read OEE, downtime analysis, and quality dashboards per shift; data-driven root-cause analysis for quality deviations, with an OEE metric definition agreed across plants so comparisons are honest.
See in Manufacturing context →Operations teams analyze on-time delivery, cost per shipment, and route efficiency; diagnostic analytics for delays and an intro to predictive analytics for seasonal capacity planning.
Unit management reads occupancy, patient wait times, and service-quality indicators; patient-data governance in analytics aligned with the PDP Law (health data as specific personal data) with aggregation before analysis.
See in Healthcare & Pharmaceuticals context →Planning & reporting units build evidence-based performance analyses and management/AGM materials, mapped to One Data Indonesia principles (data standards, metadata, interoperability) and the PDP Law, with an auditable corporate metric glossary for internal audit/state audit.
See in State-Owned Enterprises (BUMN) context →Delivery Method
Delivery Method
The format adapts to team spread and operational schedules; every format is hands-on with real analysis exercises & datasets, replacing the passive one-way lecture model.
In-house in person
Facilitators come to the company office/training site; an analysis lab using the company's dashboards & datasets (anonymized where needed) in a safe environment.
Live online
Interactive classes via Zoom/Teams with analysis breakouts, screen-share dashboard reviews, and session recordings for participants.
Hybrid
In-person sessions for intensive analysis labs & data storytelling, followed by online office hours to review analysis assignments from the team's own data.
Engagement Flow
Engagement Path
From need to an evidence-based decision culture: qualitative durations, adjusted to organization scale & maturity.
Training Needs Analysis & Level Assessment
Mapping roles, decision needs, data maturity (DELTA model reference), and an initial data literacy assessment. Output: a needs profile + measurement baseline + batch tiers.
Initial stageRole-Based Program Design (ADDIE)
Building measurable learning objectives, a role-based syllabus (leader/analyst/data owner), selecting anonymized datasets, and a framework map (DIKW/Gartner Ascendancy/Data Literacy Project).
Before deliveryDelivery: Wave 1 (Data Champions)
A champion group is trained first (70-20-10 pattern) as a data culture driver and to validate materials and the metric glossary before scaling.
First waveDelivery: Subsequent Waves & Applied Assignments
Roll-out across units with analysis labs from their own data; the analyst track climbs spreadsheet→SQL→BI tool, the executive track focuses on challenging data & data storytelling.
Rolling per batchKirkpatrick Evaluation
Level 1-4 measurement (reaction, learning, decision behavior & BI adoption, results). Phillips ROI Level 5 if finance requests a monetized figure.
After each waveData Culture Institutionalization
Office hours, monthly application reviews, a 30-60-90 day plan, reinforcing the shared metric glossary, and a data culture maturity roadmap (DELTA model).
OngoingCase Studies
Typical Outcome Patterns
An illustration of impact patterns based on similar program structures: indicative, with no named clients or promised numbers. External benchmarks (e.g. Gartner, Forrester/Tableau) are cited as industry reference, distinct from any Neksus result claim.
Branch managers at a financial services institution, one large population
Intervention
A 3-day bootcamp + real-dashboard assignments + a shared metric glossary
Result
Monthly meetings shifted to metric-based discussion with the same definitions, reducing 'whose number is right' debates
A multi-region retail team
Intervention
A multi-month tiered program (70-20-10 pattern) + an analyst spreadsheet→SQL track
Result
Some campaign analysis was done independently without long queues to the central BI team, with clearer recommendation narratives to leadership
A planning unit at an agency/SOE with many work units
Intervention
A level assessment + a data-owner track aligned with One Data principles & the PDP Law
Result
Corporate metric definitions began to standardize across units with an auditable trail, and reporting materials became more evidence-based
Procurement Info
Procurement & Vendor Management Information
What procurement, finance, legal, and data governance teams need.
A structured proposal: measurable learning objectives, a role-based syllabus, a framework map (DIKW/Gartner Ascendancy/Data Literacy Project), a data governance approach (PDP/One Data), facilitator profiles, schedule, and a cost breakdown based on the TNA results.
TNA-based: flat per program, per session, per participant, tiered, or custom. No standard figure without a needs analysis; an estimate is provided after the TNA and once batch tiers are agreed.
Flexible terms (down payment + settlement / per-batch installments); tax invoice (VAT) and PO document support available.
Familiar with SOE/agency procurement stages: vendor documents, e-procurement, owner's estimate/bid, and compliance clauses; the analytics approach is mapped to One Data Indonesia principles.
Kirkpatrick Level 1-3 evaluation report (attendance, data literacy assessment, analysis-assignment results); Phillips ROI Level 5 on finance request.
NDA signing, participant data confidentiality clauses, and anonymization/aggregation of practice datasets so no raw personal data is used (aligned with PDP Law No. 27/2022).
The metric glossary, analysis templates, and case library built for the company become the company's property; training material usage rights are agreed in the contract.
FAQ
Frequently Asked Questions
Next Step
Discuss your team's data literacy needs
We map your roles, data maturity, and decision needs, then build a proposal & budget estimate based on real needs.
- A proposal, a role-based syllabus, and a framework map (DIKW/Gartner/Data Literacy Project) within a few working days
- A data governance approach aligned with the PDP Law & One Data Indonesia principles
- Kirkpatrick impact measurement (Phillips ROI on request)
- Procurement-ready documents (company profile, tax ID, NDA, VAT invoice)
Data Literacy & Business Analytics training for your Logistics & Supply Chain team
We map your roles, data maturity, and decision needs, then build a proposal & budget estimate based on real needs.
- A proposal, a role-based syllabus, and a framework map (DIKW/Gartner/Data Literacy Project) within a few working days
- A data governance approach aligned with the PDP Law & One Data Indonesia principles
- Kirkpatrick impact measurement (Phillips ROI on request)
- Procurement-ready documents (company profile, tax ID, NDA, VAT invoice)