Power BI & Tableau Training for the Government & Public Sector Sector
Government agencies run SPBE (Perpres 95/2018) and drive public service transparency. Work unit leadership, the Inspectorate, and the public (via PPID) need consistent performance dashboards. Power BI / Tableau with certified datasets provide sustainable reporting and become SPBE Index evidence.
- 4.9/5 · 287 reviews
- 300+ clients nationwide
- 2,000+ trainers
- 1 to hundreds of participants
- Standard · Premium · Private 1-on-1
- format
- In-house / online / hybrid
- duration
- 4 intensive days per cohort
- participants
- 10–25 per cohort
- language
- Indonesian / English
2,000+ trainers and experts
Our group's teaching network, matched to what your team needs.
See class documentationYou see your trainer first
The trainer's profile, track record and field come with the proposal, before you decide.
4.9 out of 5
287 participant reviews.
300+ clients nationwide and 180,000+ private training sessions completed. Among them: MPR RI, Akademi Militer Magelang, DPRD Provinsi Jawa Timur.
One person to hundreds
Private coaching for one participant, a class for one team, or several cohorts at once.
Three budget levels
- Standard: core class, material fitted to the participants’ work
- Premium: senior trainer, deeper material design
- Private 1-on-1: one participant, one trainer, schedule set by the participant
Why Power BI & Tableau for Analysts is different in Government & Public Sector
Government agencies run SPBE (Perpres 95/2018) and drive public service transparency. Work unit leadership, the Inspectorate, and the public (via PPID) need consistent performance dashboards. Power BI / Tableau with certified datasets provide sustainable reporting and become SPBE Index evidence.
- Public service dashboard coverage with certified datasetNearly all priority public services
- SPBE Index management-domain scoreImprovement in the next assessment cycle
- Dashboard adoption by work unit leadershipMajority of leadership access directly
- Perpres 95/2018 SPBE
- PermenPANRB 3/2024 SPBE Index
- UU PDP No. 27/2022 — citizen data
- UU No. 14/2008 Public Information Disclosure
- Microsoft PL-300 / Tableau Certified Data Analyst
- Kimball Group dimensional modeling
- Head of Data & Information Center
- Head of Planning Bureau
- Deputy Inspector
- Public Information & Documentation Officer (PPID)
- Agency Senior Data Analyst
- CIO / Head of IT
- Agency IT/planning teams master BI reportable to leadership
- SPBE & public service performance dashboards used by work unit leadership
- Role-based access & UU PDP-aligned sensitivity labels
- Dashboard evidence available as SPBE Index evidence
- Budget & public service transparency rises through dashboards
Quick Answer
Corporate Power BI / Tableau training for analysts is an in-house program equipping data analysts, business analysts, and business units to build dashboards leaders use: from Kimball star schema, DAX/M & VizQL, Stephen Few visualization principles, to Cole Nussbaumer Knaflic storytelling, with Microsoft PL-300 and Tableau Desktop Specialist certification paths.
Guided by industry-recognized visualization practice
The material follows Stephen Few (Now You See It, Information Dashboard Design), Edward Tufte (data-ink ratio, small multiples), and Cole Nussbaumer Knaflic (Storytelling with Data), sources the global BI community references. Official Microsoft PL-300 and Tableau Desktop Specialist certifications become the competency roadmap.
Without modeling, dashboards end up fragile and slow
Pulling raw data into visuals without Kimball star schema modeling produces slow dashboards that break when sources change. Upfront modeling investment is a foundation that pays back many times: performance, formula simplicity, and cross-team governance.
Dashboards used = dashboards that answer
Dashboards full of charts but failing to answer leadership's main question end up saved and ignored. Storytelling with Data (Cole Knaflic) teaches audience analysis + narrative arc + decluttering so dashboards answer directly in the first 5 seconds and become the basis for decisions.
Clients & Documentation
Some of the institutions we have trained
Photos from sessions we have delivered, each one named after the institution it belongs to.

MPR RI

Akademi Militer Magelang
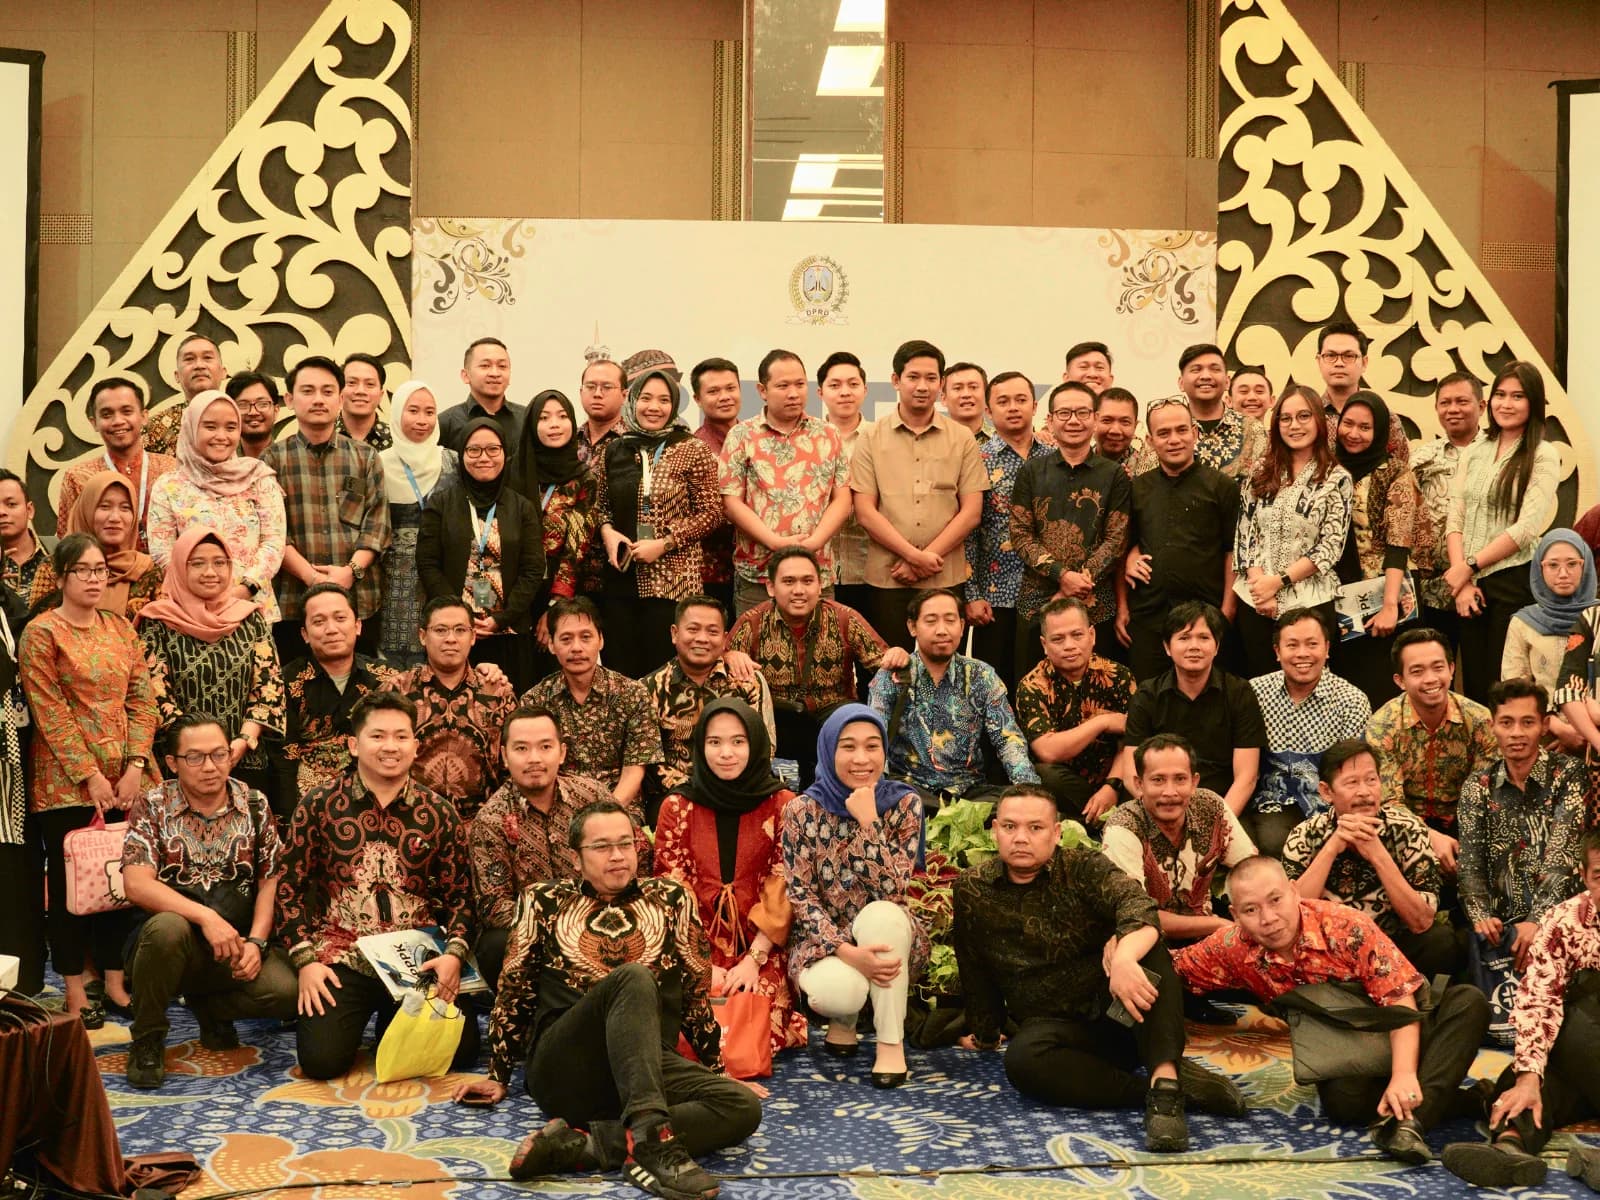
DPRD Provinsi Jawa Timur

DPMPTSP Pemprov Maluku Utara
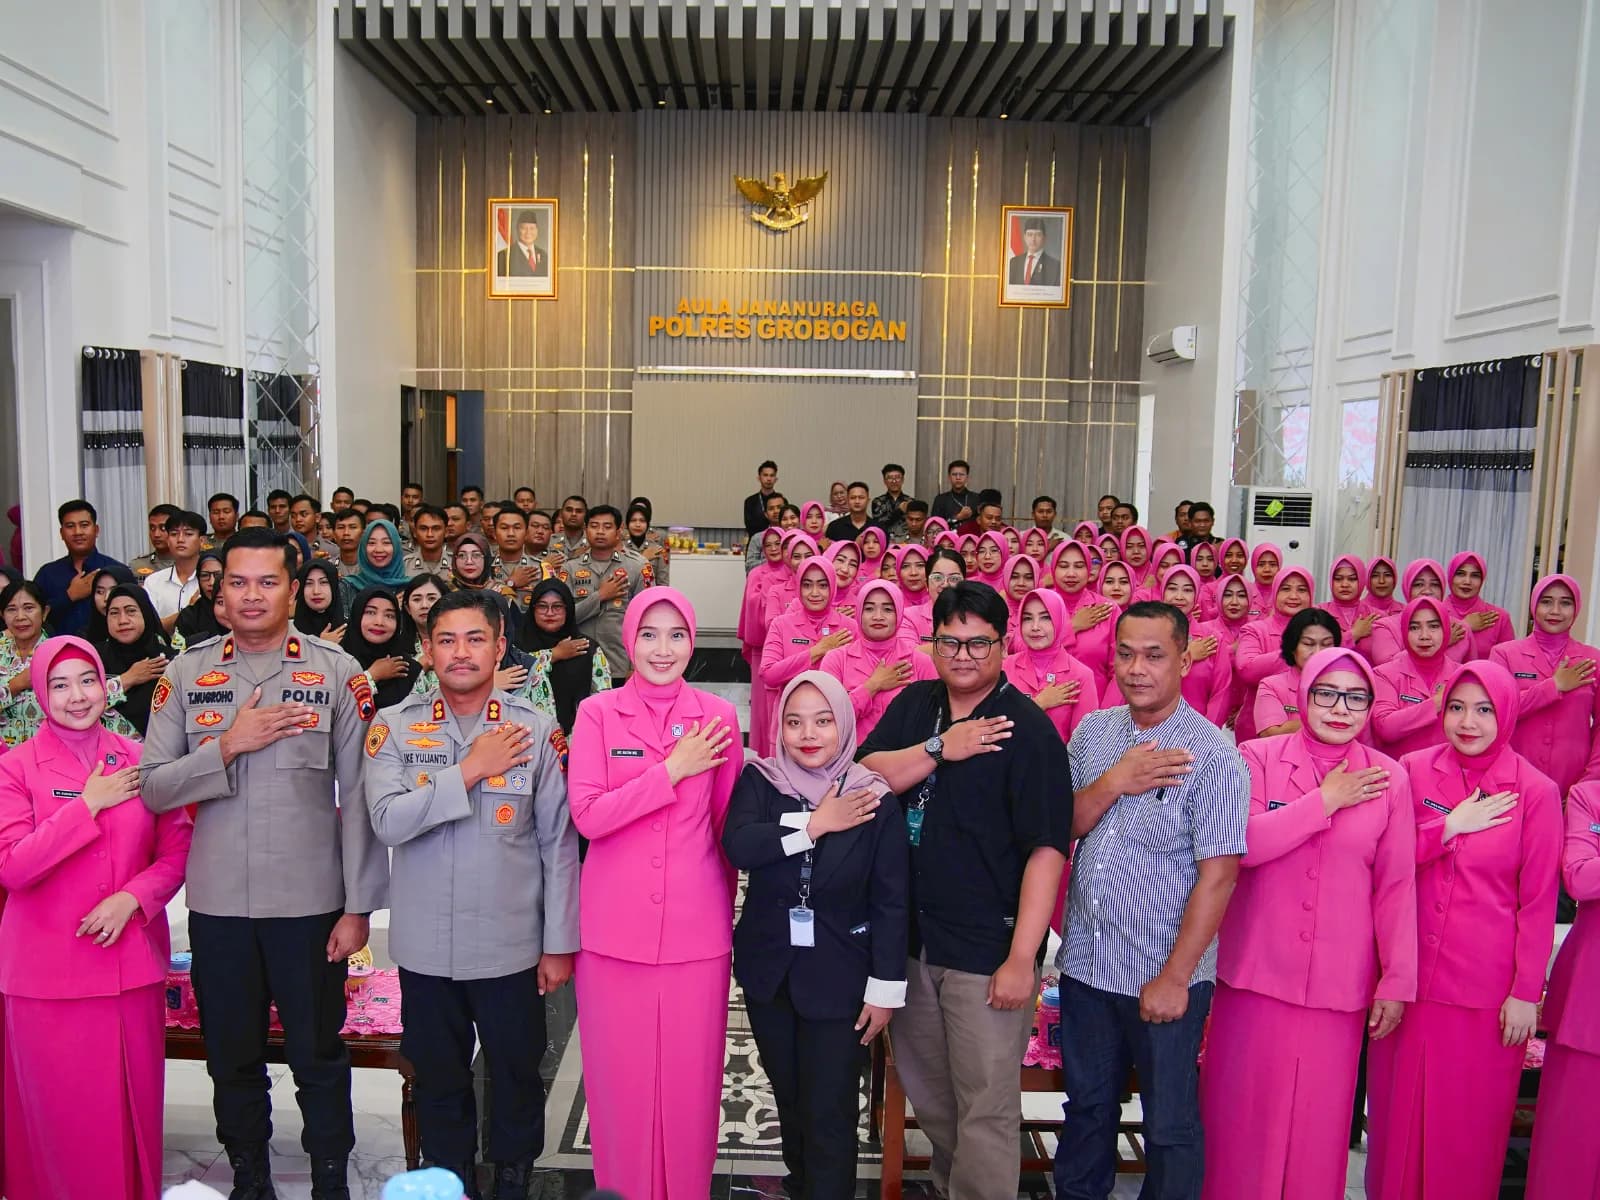
Polres Grobogan

BKPSDM Cirebon
Power BI & Tableau for Analysts
Corporate Power BI / Tableau training for analysts is an in-house program that equips data analysts, business analysts, and business units to build dashboards leaders use to decide: from data model (Kimball star schema), query modeling (Power Query M / Tableau Data Source), formula language (DAX / VizQL), visualization principles (Stephen Few), to storytelling (Cole Nussbaumer Knaflic), with official certification paths Microsoft Power BI Data Analyst (PL-300) and Tableau Desktop Specialist / Certified Data Analyst.
Measurable Outcomes
Expected Outcomes
Indicators mapped to Kirkpatrick levels and official certification competencies: qualitative targets, set during TNA against your team baseline.
- The tools are mastered to fluency
- Most participants pass Power Query M / Tableau Data Source, data model (star schema), and basic formula (DAX / calculated field) assessment. Judged through a tooling assessment when the class closes (Kirkpatrick L2).
- Data models are built healthy
- Team builds a star schema model for one real internal business domain, with documented relationships. Seen in the star model participants build for one domain (Kirkpatrick L3).
- Leaders use the dashboards to decide
- Team delivers at least 1 dashboard adopted by leadership & becomes single source of truth for key metrics. Proven when leaders open that dashboard before a meeting (Kirkpatrick L3).
- Layouts read easily and tell a story
- Participants apply Stephen Few + Cole Knaflic principles: chart selection by data type, decluttering, narrative arc.
- Ready to sit the official certification
- Participants pursuing certification map competencies to PL-300 (Power BI) or Tableau Desktop Specialist and can take the exam per individual readiness.
- Dashboard metric definitions are in order
- Structured workspace/site with role-based access, certified datasets, and documented refresh cadence. Measured by how consistent metric definitions are across reports (Kirkpatrick L4).
Program Format
Program Format Options
Chosen by target tooling (Power BI / Tableau / both) and team baseline, finalized after TNA. An analyst is generally able to build a dashboard unaided once those four days close. Companies wanting one dashboard standard across divisions continue with a phased programme of two to three months, built on work reviews and metric definition alignment.
Power BI / Tableau Bootcamp for Analysts (3–5 days)
Intensive bootcamp: data connection, Power Query M / Tableau Data Source, star schema modeling, DAX/calculated field, visualization & storytelling. Hands-on with real datasets.
Production-Grade Dashboard Workshop
Consultative workshop: team brings one priority dashboard case, facilitator guides from requirement → model → visual → storytelling → leadership adoption.
Data Modeling & Governance Workshop
Consultative session: cross-domain star schema modeling, naming convention, certified dataset, RLS/object-level security, and refresh cadence.
Recurring Analyst Enablement
Recurring program (monthly/quarterly): dashboard peer review, DAX/VizQL office hours, storytelling sessions, and quality audit cadence.
Free Consultation
Discuss your analyst team's BI plan
We map tooling (Power BI / Tableau), roles, team baseline, and priority business cases, then build a proposal and budget based on real needs.
Curriculum
Curriculum Framework
Designed via ADDIE; final modules curated by tooling (Power BI / Tableau / both), role, and TNA baseline.
- Power BI vs Tableau vs Looker comparison (Gartner Magic Quadrant for Analytics & BI Platforms context)
- Power BI anatomy: Power BI Desktop, Service, Premium / Fabric, dataset/dataflow/datamart, workspace
- Tableau anatomy: Desktop, Server / Cloud, Tableau Prep, Tableau Pulse
- When to use Power BI vs Tableau based on ecosystem (Microsoft 365, Snowflake, Salesforce, etc.)
- Learning roadmap aligned with official vendor certifications (PL-300, Tableau Desktop Specialist + Certified Data Analyst)
- Data sources: file (CSV/Excel/Parquet), database (SQL Server, PostgreSQL, BigQuery, Snowflake), API, OData
- Power Query M: filter, transform, append, merge, parameter, basic functions
- Tableau Prep Builder: flow, cleaning step, join, union, output
- Incremental refresh, query folding, and efficient practices pulling large data
- Common anti-patterns: importing raw data into dashboards, transformation in visuals
- Why star schema: query performance, formula simplicity, sustainable models
- Fact vs dimension tables; surrogate key; slowly changing dimension (SCD type 1 & 2)
- Cardinality & cross-filter direction; bridge table; role-playing dimension (date)
- Calculation group (Power BI) / parameter & set (Tableau)
- Anti-patterns: unnecessary snowflake models, uncontrolled many-to-many, accumulating calculated columns
- Calculated column vs measure: when each is right
- Evaluation context: row context, filter context; CALCULATE as context-changing operator
- Time intelligence: YoY, YTD, MTD, rolling average with DATESYTD/SAMEPERIODLASTYEAR/DATEADD
- Common patterns: top N + others, dynamic measure with calculation group, RLS with USERPRINCIPALNAME
- DAX debugging: DAX Studio + variables; measure performance metrics
- Calculated field: regular, aggregate, level of detail (LOD) expression (FIXED, INCLUDE, EXCLUDE)
- VizQL & how Tableau turns drag-drop into queries
- Table calculation (running total, percent of total) vs LOD: when each is right
- Parameter & dynamic title; what-if analysis; R/Python integration via TabPy when needed
- Performance: hyper extract vs live; vizql server caching; data source filter
- Chart selection by question type (comparison, composition, distribution, relationship, trend)
- Stephen Few principles (Now You See It, Information Dashboard Design): data-ink ratio, eliminating chartjunk, pre-attentive attributes
- Edward Tufte: small multiples, sparklines, data density
- Storytelling with Data (Cole Nussbaumer Knaflic): audience analysis, narrative arc, decluttering, focus via color & emphasis
- Dashboard layout: F-pattern, hierarchy, mobile-friendly when relevant
- Workspace (Power BI) & site / project (Tableau): structure for large organizations
- Security: row-level security (RLS), object-level security (OLS), dynamic security
- Certified dataset / certified data source as single source of truth
- Refresh cadence: scheduled refresh, on-prem gateway, failure monitoring
- Cross-team governance: naming convention, metric taxonomy, audit log, sensitivity label (UU PDP)
Comparison
Choosing the Format & Tooling
Concise decision matrix: final recommendation set after training needs analysis.
| Aspect | Power BI / Tableau Bootcamp | Production-Grade Dashboard Workshop | Data Modeling & Governance | Recurring Analyst Enablement |
|---|---|---|---|---|
| Primary goal | Tooling fundamentals mastery | One leadership-ready dashboard | Single source of truth | Living analyst community |
| Ideal participants | New/deepening analysts & business | Teams with priority case | BI lead + multi-team analysts | Large organizations with many analysts |
| Typical duration | 3–5 intensive days | 2–3 day workshop | 1–2 week consulting | Monthly / quarterly |
| Main output | Fundamentals mastery + labs | Leadership-adopted dashboard | Star schema + governance | Peer review + standards |
| Related certification | PL-300 / Tableau Desktop Specialist foundation | PL-300 / TDA application | Data Analyst Associate supporting | Mature practitioner |
For Whom
Who This Program Is For
Designed by role because Power BI / Tableau usage differs for data analyst vs business analyst vs finance.
Data Analyst
Teams producing dashboards & analytics for many business users.
Common challenges
- Data models unstructured; every dashboard repeats the same transformations
- DAX/VizQL learned from recipes without concept: hard to debug wrong formulas
- Dashboards full of charts but don't answer leadership's main question
Business Analyst / Business Unit
Users building self-service dashboards for their own teams.
Common challenges
- Uncomfortable with data modeling; pull raw data into visuals and get confused
- No consistent visualization language: charts chosen arbitrarily
- Hard to share & maintain dashboards used by many people
Finance / Controlling Analyst
Teams producing financial reports & FP&A.
Common challenges
- Excel-based; hard to scale; prone to formula errors
- Not using time intelligence (YoY, YTD, rolling) consistently
- Periodic reports manual; no self-service for leadership
Operations / Process Analyst
Teams monitoring operational metrics (production, service, fulfillment).
Common challenges
- Data scattered across many sources without integration
- Operational dashboards often lag; not real-time when needed
- No actionable alerts or thresholds
BI Lead / Data Lead
Owner of BI governance and metric consistency accountability.
Common challenges
- No certified dataset; metrics differ across teams
- BI adoption stalls at analysts; leadership still requests ad-hoc reports
- No dashboard quality audit cadence
Industry Context
Industry Applications
One specific use case per industry, naming relevant metrics, regulations, and dashboard patterns.
Digital channel performance & fraud/AML monitoring dashboard in Power BI / Tableau for bank leadership, with certified datasets, RLS per branch/segment, and audit trail defensible to OJK (POJK 11/POJK.03/2022 IT risk management).
See in Banking & Financial Services context →OEE, quality, downtime, and supply-chain dashboards for plants & corporate manufacturing, combining PLC/SCADA, MES, and ERP data into certified datasets used by operations & management.
See in Manufacturing context →Self-service analytics for product, marketing, and growth teams, with certified datasets, consistent product metric taxonomy, and dashboards that become single source of truth for executive meetings.
See in Technology & Startups context →BI standardization across BUMN holding subsidiaries: holding certified dataset, consolidation metric taxonomy, and board dashboards defensible to AGM & BPK.
See in State-Owned Enterprises (BUMN) context →Sales, inventory, loyalty, and e-commerce dashboards for modern retail, combining POS, ERP, marketplace, and loyalty platforms into certified datasets used by daily merchandising, marketing, and operations.
See in Retail & FMCG context →SPBE performance, digital public service, and budget transparency dashboards for central & regional government agencies, with role-based access, UU PDP compliance, and SPBE Index readiness.
Delivery Method
Delivery
Format adapts to your analyst team distribution; all formats hands-on with practice datasets + your internal dataset.
On-site intensive & workshop
Facilitator comes to your office for a 3–5 day bootcamp; labs in Power BI Desktop / Tableau Desktop, with internal dataset as case study (NDA applies).
Live online + managed labs
Interactive classes via Zoom/Teams; labs in local Power BI / Tableau Desktop + access to workspace/site provided by Neksus.
Hybrid
On-site for intensive modules (storytelling, production-grade dashboard), online for concept & lab modules. Suits multi-location teams.
Engagement Flow
Engagement Path
Follows ADDIE + Kimball lifecycle for dashboard development: qualitative durations, scaled to baseline.
Training Needs Analysis & Baseline
Mapping target tooling (Power BI / Tableau / both), roles, team baseline, internal dataset to use as case study, and priority business cases.
Initial stageProgram Design by Role (ADDIE)
Drafting measurable learning objectives, role-based syllabi (data analyst, business analyst, finance, operations), lab scenarios, and framework map to PL-300 / Tableau Desktop Specialist.
Pre-deliveryPower BI / Tableau Bootcamp
Core 3–5 day session: data connection, Power Query M / Tableau Prep, star schema modeling, DAX/calculated field, visualization & storytelling. Hands-on with practice datasets.
Core weekProduction-Grade Dashboard Workshop
Team brings one priority dashboard case; facilitator guides from requirement → model → visual → storytelling → leadership adoption.
Post-bootcampData Modeling & Governance Roll-out
Consultative session: cross-domain star schema modeling, naming convention, certified dataset, RLS/OLS, sensitivity label, and refresh cadence.
Rolling per domainAnalyst Enablement & Recurring Evaluation
Monthly/quarterly cadence: dashboard peer review, office hours, storytelling sessions, Kirkpatrick L1–L4 evaluation (Phillips L5 on request), quality audit.
Recurring & continuousCase Studies
Typical Outcome Patterns
Illustrative patterns based on similar program structures. No named clients or promised numbers. Vendor certifications (PL-300, Tableau Desktop Specialist), Stephen Few principles, and Cole Knaflic storytelling are attributed as external sources (Microsoft Learn, Tableau, Stephen Few, Cole Nussbaumer Knaflic).
Financial institution with many channel & risk dashboards
Intervention
Bootcamp + production-grade dashboard workshop + certified dataset + RLS
Result
Board dashboards flow consistently from certified dataset; management meetings discuss single numbers
Manufacturer with many plants
Intervention
Daily OEE dashboard workshop + PLC/MES/ERP integration + storytelling
Result
Plant manager uses dashboard as shift review basis; operations meetings accelerate decisions
Government agency running SPBE
Intervention
Bootcamp + public service dashboard workshop + governance & sensitivity label
Result
Work unit leadership uses public service performance dashboards; evidence available for SPBE Index
Procurement Info
Information for Procurement & Vendor Management
What procurement, finance, and BI / data units need.
Structured proposal: measurable learning objectives, role-based syllabus, framework map (Kimball dimensional modeling / Microsoft PL-300 / Tableau Desktop Specialist / Stephen Few / Cole Knaflic / UU PDP), facilitator profile, schedule, and TNA-based cost detail.
TNA-based: flat per program, per session, per participant, tiered, or custom. Estimate issued after TNA is agreed.
Flexible terms (DP + balance / per-batch installments); tax invoice (PPN) and PO documentation supported.
Familiar with BUMN/government procurement: vendor documentation, e-procurement / SPSE, HPS/offers, and compliance clauses.
Kirkpatrick L1–L3 evaluation reports (attendance, knowledge assessment, behavior: dashboards built & adopted); Phillips ROI L5 on finance/risk request.
NDA signing, confidentiality of internal datasets used as case studies, and practices aligned with UU PDP and your internal security policy.
Dashboards, data models, and documents built for your company are yours; usage rights of training materials are agreed in the contract.
FAQ
Frequently Asked Questions
Next Step
Discuss your analyst team's BI plan
We map tooling (Power BI / Tableau), roles, team baseline, and priority business cases, then build a proposal and budget based on real needs.
- Proposal, role-based syllabus, and framework map (Kimball / PL-300 / Tableau / Stephen Few / Cole Knaflic)
- Labs with practice datasets; option to use non-sensitive internal datasets
- Procurement-ready documents (company profile, NPWP, NDA, PPN tax invoice)
Power BI & Tableau for Analysts training for your Government & Public Sector team
We map tooling (Power BI / Tableau), roles, team baseline, and priority business cases, then build a proposal and budget based on real needs.
- Proposal, role-based syllabus, and framework map (Kimball / PL-300 / Tableau / Stephen Few / Cole Knaflic)
- Labs with practice datasets; option to use non-sensitive internal datasets
- Procurement-ready documents (company profile, NPWP, NDA, PPN tax invoice)